
From floppy disk to web portal
2005: a mandatory dealer benchmarking process depended on post and fax. An online portal brought results to the dealer account in around 15 minutes.
The year was 2005.
Dealer benchmarking was based on data from the dealer management systems of a major international automotive manufacturer. Participation in the benchmarking process was mandatory. A good validation result also affected the dealer’s new vehicle margin.
However, the process was still entirely physical: dealers prepared a trial balance, saved the data on a floppy disk and posted it to the data centre.
Operators manually loaded and processed the disk and then faxed the validation results back to the dealer. If corrections were needed, the process started again: correct the data, create a new disk, post it and wait for the result once more.
Floppy disks were fragile. Sometimes the data arrived unreadable and had to be sent again. This caused frustration and time pressure, particularly close to the end-of-month submission deadline.
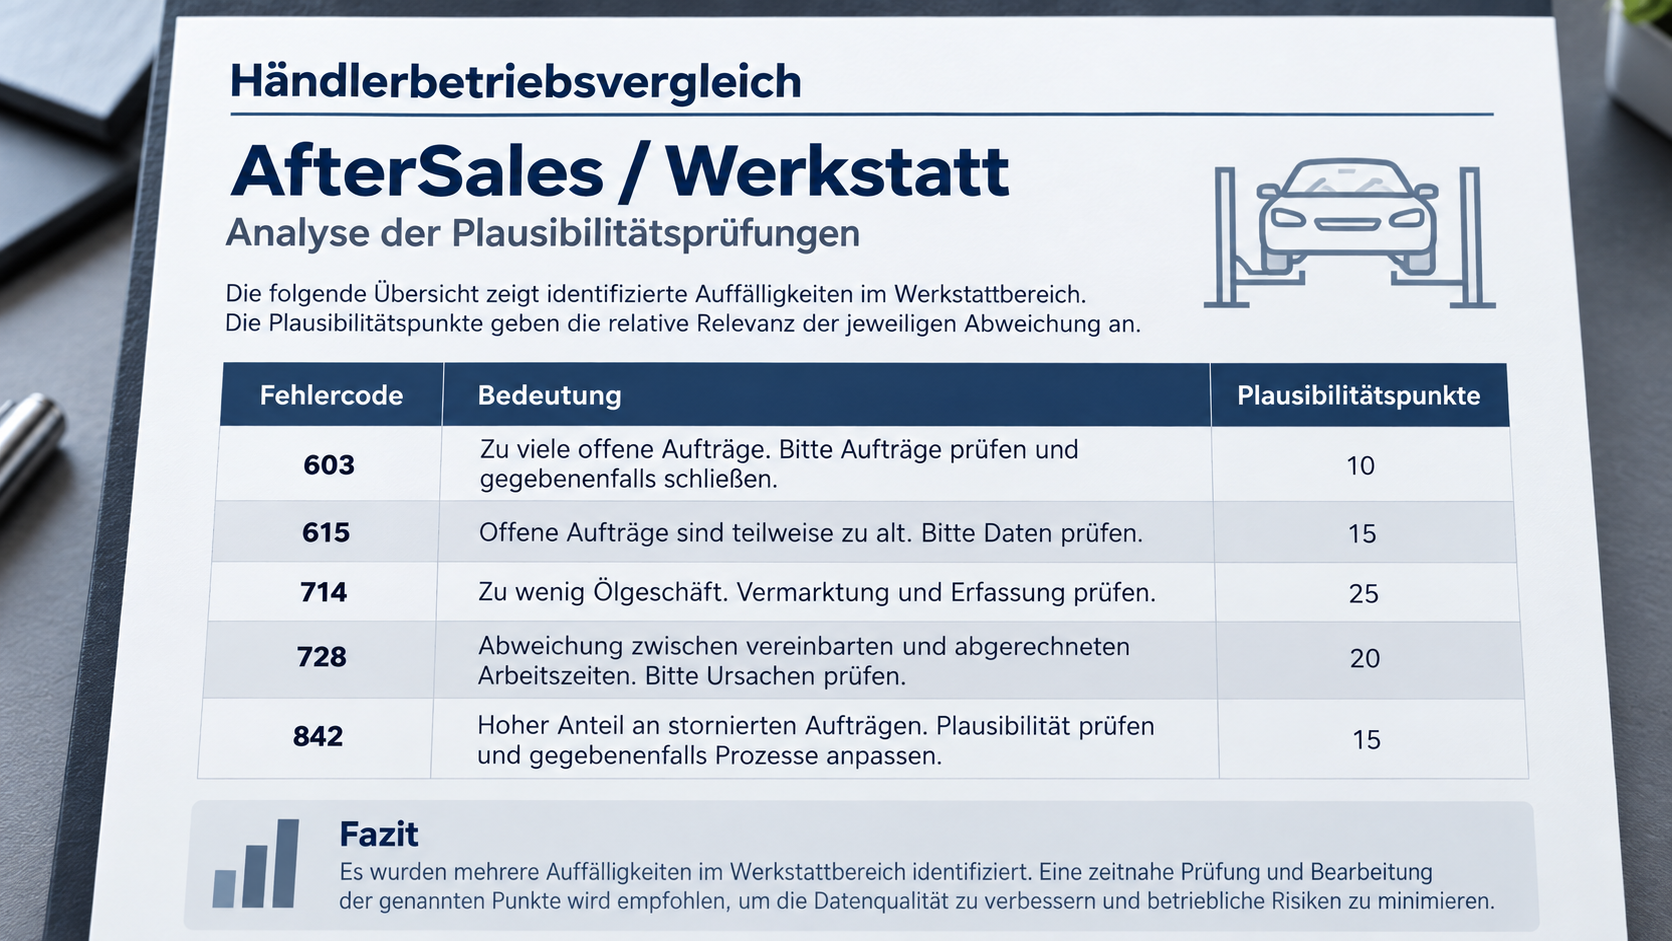
The business validation was also demanding: around 650 plausibility and validation rules identified anomalies in accounts, data and operational relationships.

The old solution had fallen behind the times
The idea: direct feedback.
I developed a vision for an online portal where dealers could log in and upload their trial balances directly. After around 15 minutes, the file had been processed automatically and the result was available in the dealer's account.
Dealers could immediately see which data had been flagged, investigate causes, make corrections and resubmit the file.
I created the design and supported coordination, implementation and introduction.
A linear mailing process became an interactive workflow:
upload → view results → investigate the cause → correct → resubmit
Greater transparency for both sides
The manufacturer, as the client, could view results and submission rates during the current reporting month. A dealer history made developments over time visible. Filters helped identify dealers with weak results or other anomalies and investigate them directly.
Additional analyses enabled comparisons between dealer groups or average results, for example.
Dealers, in turn, gained a clearer understanding of which data had been flagged and why.
To support a successful introduction, I trained all dealers and was available by telephone for questions and assistance during the initial phase.
Technical digitisation was only part of the benefit. The real gains were shorter feedback loops, greater transparency and more independence for dealers.
Our telephone hotline workload as the evaluation service provider also fell significantly, because after introduction and training dealers could make many corrections independently.